P10’s cash earnings are consistent, contractually guaranteed, and high quality. They do not change with interest rate changes or oil prices, and they are still growing in a tough market. Currently, P10’s stock is being priced more on market flows than the company’s fundamentals and eventually this will correct.
The free cash flow yield is now over 9%. Total assets under management at year end were 21.2 billion up 23% from the year prior. Management is on track to use all its NOLs which when combined with amortization tax assets, the company will have not have a federal income tax bill for the next several years (state taxes still apply).
Organic growth is starting to slow in the face of rising interest rates this year and will “only” be in the low teens for 2023. If this is what a slow year for fund raising looks like, we’re still in good shape. P10’s largest manager, RCP Advisors, closed a new fund subscription on March 31 this year with 328mm of new funds to manage. Yes, fundraising may be more competitive this year but we are still seeing meaningful organic growth.
In the fall of 2022, P10 closed on WTI, a venture credit solutions provider. With venture capital firms facing a less friendly market for equity deals, WTI is likely to find more firms turning to debt to avoid heavy stock dilution, another plus for P10’s multi-asset class model.
Buyback authorization was first announced in January 2022, but the first shares weren’t bought back until fall. Management bought a touch under 2 million shares or 1.7% of the company @ $9.62 in 2022. All the shares were purchased through negotiated block trades at ~8% discounts to market prices. In March 2023, the company bought another 100,000 shares at $8.51. It should come as no surprise to anyone who follows P10’s management to see that they waited patiently until the price was right to buy and then bought in size.
It might take a while, but eventually the quality of p10’s earnings will carry the day, until then enjoy the buybacks.
Share Count Diluted: 125 mm, Market Cap: 1.5 billion, EV = 1.84 billion
2022 est. EBITDA = 100 mm, EV/EBITDA = 18.4
Opportunity
P10 Holdings is a multi-asset class, private markets solution provider in the lower/middle market alternative asset space. Its business model delivers high margin revenue and highly predictable returns from the ownership of the management and advisory fees of the fee-paying assets under management (FPAUM). With just a 1.5 billion market cap, strong organic growth, an unique and attractive value proposition for the companies it acquires, PX should be capable of 25% plus annual increases in FPAUM, revenue and free cash flow.
P10 Introduction
For its customers, P10 Holding offers its clients differentiated access to a broad set of solutions and specialized investment vehicles primarily in the lower/middle market alternative asset space.
For its shareholders, P10 Holdings is a company with an attractive business model that generates extremely predictable, recurring, high margin fixed management fees earned on the committed capital in long-term contractually locked up funds.
Our revenue is composed almost entirely of recurring management and advisory fees, with the vast majority of fees earned on committed capital that is typically subject to ten to fifteen year lock up agreements. We have an attractive business model that is underpinned by highly recurring, diversified management and advisory fee revenues, and strong free cash flow. The nature of our solutions and the integral role that our solutions play in our investors’ investment decisions have translated into high revenue visibility and investor retention.
From the 2021 Prospectus
Unlike financial holding companies that purchases an equity stake in an asset manager’s general partner, P10 only purchases the management fee of the solution provider it acquires for cash and stock and leaves the performance fee and carried interest of the acquired fund with the original management team. The acquired company becomes a variable interest entity (VIE) under P10 Holdings. This structure ensures the acquired managers continue focusing on performance and can continue raising new assets off their track record.
We specifically aim to eliminate perceived challenges facing many publicly traded alternative asset management firms, (i) earnings volatility due to lumpiness of carried interest, (ii) tax complexities from the ownership of management and advisory fees and carried interest in publicly traded partnerships and (iii) potential misalignment of interest between investment professionals and the shareholders.“
From the 2021 Prospectus
Established solution providers are incented to sell to P10 because the P10 business model allows the sellers the opportunity to exchange the equity built up in their private partnerships for cash and shares of a diversified public company without losing their ability to earn the performance carry on the current and the future assets they manage and raise. For P10, the same fee split structure ensures the fund’s management team stays fully motivated to outperform.
P10 History and Management
The history of P10 Holdings begins with 210 Capital LLC which Robert Alpert, 56, and Chuck Webb, 40, co-founded in 2017. In addition to P10, 210 Capital owns or controls Crossroads Systems, Elah Holdings, and Globalscape. Alpert and Webb serve in executive roles at all their companies as either CEO, co-CEO, and/or Chair.
Prior to founding 210 Capital, Robert Alpert was the founder and portfolio manager of Atlas Capital Management, LP, a long-short strategy investment adviser from October 1995 to September 2015. Previously, Clark Webb was a Co-Portfolio Manager of the Lafayette Street Fund and a Partner at Select Equity Group, L.P.
In 2017, 210 Capital acquired what became P10 Holdings out of bankruptcy court and through a support agreement made Robert Alpert and Clark Webb co-CEO’s of P10 Holdings with Alpert also serving as Chair. As of June 30, 2021, 208 million of Net Operating Loss (NOL) carry forwards remain available.
At inception, P10 was an empty shell corporation without an operating business. In October 2017, Alpert/Webb’s first P10 acquisition was RCP Advisors, a sponsor of private equity, funds-of-funds, secondary funds, and co-investment funds. Since its founding in 2001, RCP Advisors has raised approximately $7 billion of committed capital and maintains one of the largest internal teams dedicated to North America middle and lower-middle market private equity.
Importantly, P10 only receives the management fees generated from the RCP funds, not the carried interest. We believe that the carried interest provides an alignment between the RCP investment team and its investors. In other words, we want the carried interest to go to the RCP professionals, as it provides those individuals with economic incentives to continue to perform on behalf of investors. The benefit to P10 is twofold: (1) we have an RCP team that remains highly motivated to perform; and (2) the P10 revenues consist almost exclusively of highly predictable and stable management and advisory fees. Moreover, we have an extraordinary team in place with significant capacity to add incremental assets undermanagement (“AUM”). As a result, to the extent we can continue to grow our AUM, thereby growing our management fees, we would anticipate an expanding profit margin and growing earnings for P10. For 2018, we project the RCP business should generate an EBITDA margin in excess of 50% of revenues; and because our management fees are, for the most part, locked up by contract for up to a decade, we believe this profit stream will prove to be stable.
As part of the transaction, RCP principals received 44.17 million shares of P10 common stock, representing approximately 49.5% of our post-acquisition capitalization, making them the largest stockholders of P10, by far. Two RCP partners, Fritz Souder and Jeff Gehl also joined the board of directors of P10. “In addition to the shares of common stock, P10 issued to the RCP principals approximately $117 million in principal amount of non-interest bearing promissory notes (the “Sellers’ Notes”).”
From the 2017 P10 Shareholder letter
The projections in the letter proved out. RCP revenues in 2018 were 32 million with margins of 55%. Additionally, Fritz Souder continues to serve on the P10 board and as Chief Operating Officer of P10 Holdings as well as Managing Partner and President of RCP. Jeff Gehl continues as Head of Marketing and Distribution of P10 Holdings as well as Managing Partner and Vice President of RCP. Jeff Gehl remained on the P10 board until September 2021 when he stepped down to make room for Ewin Poston, managing partner of TrueBridge Capital and Scott Gwilliam from Keystone Capital to join the board.
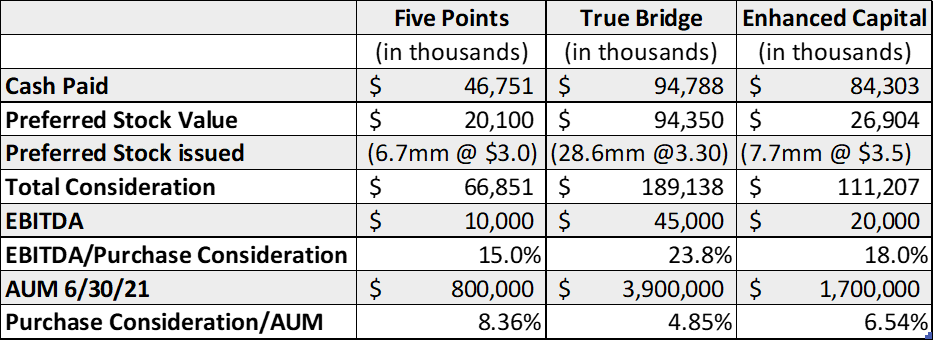
P10’s 2020 Acquisitions
Figure 1. From P10 2021 Q3 Investor Presentation
In April 2020, P10 acquired Five Points, a lower middle market alternative investment manager focused on providing both equity and debt capital to private, growth-oriented companies and LP capital to other private equity funds. At acquisition, its strategies focused exclusively on the U.S. lower middle market. Since its founding over two decades ago, Five Points has successfully raised and deployed more than $1.5 billion on behalf of institutional and high net worth clients.
In October 2020, P10 closed on the acquisition of TrueBridge, a leading venture capital investment firm managing more than $3.3 billion in assets. TrueBridge invests in venture and seed/micro-VC funds focused primarily on early-stage IT, as well as directly in select venture and growth stage technology companies.
In December 2020, P10 closed on the acquisition of Enhanced Capital, LLC, an impact investment firm with a two-decade history of deploying capital into socially responsible investment areas including small business lending, renewable energy, and women and minority owned businesses. Since inception, Enhanced has deployed more than $3 billion across its impact verticals.
On September 30, 2021, P10 purchased Bonaccord Capital Partners and Hark Capital from the asset manager abrdn. Unlike their acquisitions of stand-alone companies which include a stock component, this was a cash transaction for 40 million and up to 25.4 million in earnouts. The management teams will transition to P10 and operate from within the P10 Private Equity and Private Credit asset management groupings respectively.
Bonaccord acquires minority equity investments in a diversified portfolio of alternative markets asset managers with a focus on mid-sized managers across private equity, private credit, and real assets. Hark provides loans to mid-life private equity, growth equity, venture, and other funds. P10 expects the transactions to add approximately $900 million in fee paying assets under management.
Price paid for 2020 Acquisitions
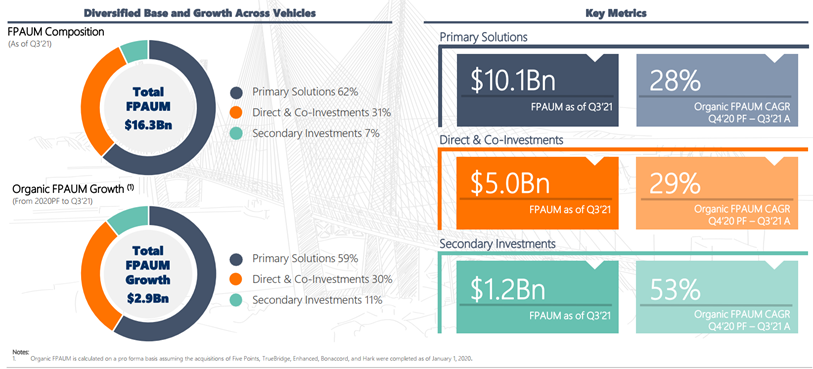
Historical Performance Drives Organic Growth
P10’s organic growth is strong and is growing about 30% pro-forma in 2021. Given past performance, the ability of the management teams to raise larger sums for their newest funds in a strong market is not surprising. P10 fund raising benefitted in 2021 from a favorable fund offering calendar, but in 2022, there will be fewer new offerings of existing strategies as not every product is offered every year. Based on the calendar, 2023 and 2024 will have more new offerings than 2022.
Growth driven by leveraging relationships in P10’s Private Market ecosystem
The private market ecosystem lends itself to cross-solution sourcing of investors and investments as well as leverage its proprietary database of middle and lower middle market private venture data.
As we expand our offerings, our investors entrust us with additional capital, which strengthens our relationships with our fund managers, drives additional investment opportunities, sources more data, enables portfolio optimization and enhances returns, and in turn attracts new investors. We believe this powerful feedback process will continue to strengthen our position within the private markets ecosystem. In addition, our multi-asset class solutions are highly synergistic, and coupled with our vast network of general partners and portfolio companies, drive cross-solution sourcing opportunities.”
from the 2021 S-1
Figure 4. From 2021 Q3 Presentation
Growth through Geographic expansion
Second, there are opportunities for cross selling and leveraging networks of investors and investments across the company’s platform especially geographic expansion. At the Annual meeting in July 2021, Alpert/Webb gave the example of introducing the TrueBridge fund to European investors in its network where TrueBridge was previously unknown and raised 700mm in new commitments.
Alternative Assets Market Growth
P10’s middle and lower-middle markets funds that invest in portfolio companies with revenues between $25 and $500 million is an underserved, growing and relationship-oriented market where growing scale generates a self-reinforcing virtuous cycle. This market is too small for firms like BlackRock with trillions in assets to pursue, but it is a long runway for growth for a firm like P10.
Figure 5. From 2021 Q3 Presentation
Acquisitions
While future acquisitions are a given, their timing will never be predictable. At the Annual Meeting in July 2021, Robert Alpert mentioned that discussions are usually occurring with 6-7 firms at any time, but obviously most discussions do not lead to transactions.
We expect to expand within other asset classes and geographies through additional acquisitions and future planned organic growth by providing additional specialized investment vehicles within our existing investment asset class solutions. As of the date of this prospectus, we are pursuing additional acquisitions and are in discussions with certain target companies, however the Company does not currently have any agreements or commitments with respect to any acquisitions.”
From the 2021 S-1
P10 IPO
In October 2021, P10 up listed from trading as PIOE on the OTC market to PX on the NYSE through an IPO with lead book running managers Morgan Stanley, JP Morgan, and Barclays. The company sold 23 million class A shares at $12 in the IPO. The shares were half primary and half from insiders. The 130 million raised in funds from the primary sales were directed to corporate debt reductions while the corresponding insider sales reduced insider holdings by approximately 7%. After the IPO, insiders own 57% of the economic interests and 69% of the voting power.
Commencing with the IPO, the previously held 126 million shares of PIOE were reduced to 7 shares for every 10 in a reverse split and became 97 million class B shares with 10x voting rights. Holders of Class B common stock may elect to convert shares of Class B common stock on a one-for-one basis into Class A common stock at any time. With limited exception, upon any transfer, Class B common stock converts automatically on a one-for-one basis to shares of Class A common stock. The voting rights are subject to a “Sunset” provision triggered by when the original class B holders cease to maintain control of 10% of the shares, 25% of the voting rights, or 10 years which ever happens first.
The IPO shares were originally indicated at a $14-$16 range making the final pricing at $12 a disappointment. The unfamiliarity of P10 to market participants was probably the biggest negative factor on the pricing, but the use of dual class stock, even with a sunset provision, likely played a role as well.
As I am investing in P10 specifically for Alpert and Webb’s leadership and vision, I do not see the lack of ability to easily remove them in the first ten years as a negative. I will however miss the price insensitive purchases of PX stock from the index fund buyers of the indexes that do not track dual class stocks. Given the high ownership of PX by insiders already, the use of two class stock seems unnecessary, but my hunch is that Alpert and Webb expect future acquisitions of sizes to be large enough to change the balance of ownership without it.
Value of NOLs
Given the predictability of P10’s earnings stream, P10 is the first NOL shell company I’ve ever owned where I am confident that all federal tax carryover losses will be consumed. The $208mm on 125mm shares is currently worth an undiscounted $1.66 per share in saved taxes.
While we anticipate $0 of federal income tax for several years, we will have some state and local income taxes”
Q3 2021 Investor Presentation
New Credit Line
“A new credit facility provides for a term loan in the amount of $125 million and a revolving commitment in the amount of $125 million. The company will use the loan proceeds to pay off the outstanding borrowings under its existing credit facility, pay off seller’s notes related to the RCP acquisition, and pay transaction-related expenses, as well as for working capital and other general corporate purposes.
Terms of the new credit facility call for a variable interest rate of approximately two and a quarter percent (2.25%) which offers significant savings over the seven percent (7%) interest rate with the previous credit agreement.“
December 23, 2021 announcement
Not only will this net savings of over 5 million annually (4.75% *125mm), the granting of these terms by JP Morgan Chase confirms the stability and visibility of earnings provided by the P10 business model.
Comparables
Hamilton Lane (HLNE, MCap=3.2B, EV=3.7B) with 3x the fee-paying AUM (FPAUM) of P10 and StepStone Group (STEP, MCap =1.9B, EV=3.0B) with 4x are the closest comparable public companies to P10. Both competitors maintain ownership of the performance carry in their funds which increases profitably in rising markets but reduces revenue visibility and steadiness. Both are highly profitable companies with EBITDA margins in the upper 40’s. Unlike P10, STEP provides infrastructure and real estate options.
Hamilton Lane and StepStone both benefitting from growth in private market assets.
Reasons to sell
If Alpert/Webb were to leave or sell out, I would exit as this is fundamentally a relationship business and the loss of current leadership would likely result in a period of underperformance.
A more likely risk is that more firms begin to pursue small private alternative asset credit funds and in doing so, increase the cost of P10’s acquisitions.
If a P10 component fund starts underperforming, its future fundraising will be impaired. This is partially mitigated by P10 continually acquiring new managers with strong histories to increase the number of top performing funds for clients to choose from and keeping product offerings fresh. However, a rash of underperformance not tied to macro events would be a flag.
Lastly, a major economic change could clearly impact P10 as the alternative asset classes have certainly benefitted from investors seeking substitutes for low yielding securities.
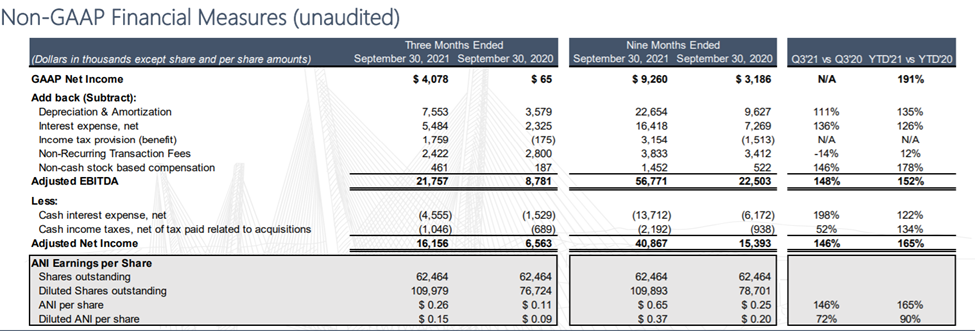
P10 Financials Pre-IPO
Post IPO adjustments
Cash raised from sell of new shares = 130 mm
Post IPO, Debt – Cash = 315.5 + 199 – 21.6 -130 = 362.9 mm
New Share Count (diluted) = 125 mm
Share Price = 11.8 on Jan 30, 2022
Market Cap = 1.475 b
Enterprise Value = 1.84 b
2022 EBITDA est. = 100 mm
2022 EV/EBITDA = 18.4
Valuation
I am using a simplistic model with simplistic assumptions to generate a range of outcomes.
Organic growth of 15-20%. 2021 organic growth was 30%, but 2021 was a peak cycle year at RCP. 2022 is a low cycle year with fewer new funds scheduled to open than in 2021 or are projected to open in 2023.
P10 acquisition growth was over 80% in 2021 and I certainly expect more acquisitions in the coming years but modeling more than 10-20% annually seems like magical thinking.
I expect most acquisitions going forward to be paid with cash from the new credit line, but some transactions may still use a modest amount of common stock. For comparison, the Enhanced acquisition consumed $27 million in stock, while True Bridge required $84 million. Whereas the most recent acquisitions from abrdn were all cash. In the table below, I retain all earnings and increase debt and stock in both scenarios for acquisition funding. More time spent on the cost of acquisitions would improve the model, but a rough guess is sufficient for my purposes.
I expect a slight increase in the adjusted EBITDA margin as the company scales in FPAUM.
As organic growth continues, I expect P10 to rate a slightly higher valuation rating closer to HLNE.
The decision to purchase P10 comes down to whether one believes the company can continue to grow AUM at 25% – 40% annually over the next decade through a combination of organic growth and continued accretive acquisitions.
My answer is yes, because I find the P10 business model advantaged in its ability to acquire well-run private asset firms in the attractive alternative asset space at private company prices, incent the management to manage existing assets while continuing to add new ones, and receive a premium valuation for the growth potential.
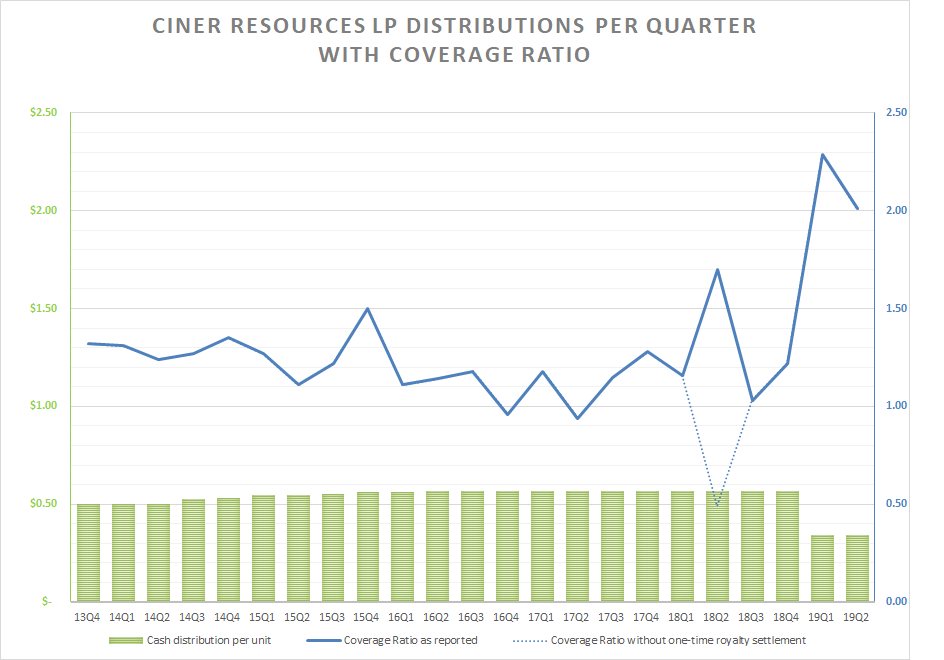
Ciner Resources LP (NYSE: CINR) is a Master Limited Partnership (MLP) that owns 51% of Ciner Wyoming LLC, one of the lowest cost producers of soda ash in the world. In the spring of 2019, Ciner LP shares, or units in MLP terminology, were regularly yielding 9% with a 1.1x coverage ratio. Management, in order to fund an expansion project to grow production by one third, cut the $.57 quarterly distribution by 40% to $.34 in May 2019. Four months later, the unit price is down nearly as much, but the yield is back to 8.6% with an improved 2.0x coverage ratio and a roadmap to increased distributions. Management projects the cut to remain in place for 9-11 more quarters after which the distributions will be increased to target a 1.2-1.3 coverage ratio.
Investors who buy now will collect an 8.6% yield for the next two and a half years until the distribution is reset to a 1.3 coverage ratio, for an approximately $.45 to $.50/quarter distribution. In years 3 and 4, the distribution will climb to roughly $.60/quarter by the end of year 5 as production ramps. A $2.40 distribution should support a $28/unit price at a well-covered 8.5% yield. At today’s $15.75 price, that’s a 20% IRR for 5 years.
Why does this opportunity exist?
MLP’s are mostly owned directly by individuals, or indirectly though high-income funds, that price stocks excessively on yield. These same individuals who underestimated the risk of a distribution cut when the unit price was higher are now underestimating the value of the MLP after it redirected 40% of the distribution into new capital investments. In ten quarters, the distribution will be raised, but today’s sellers won’t be around to benefit.
Additionally, CINR’s thin daily trading volume of 15,000-25,000 units leads to overreactions exposing market inefficiencies. With a public float of only 22%, or 5.5 million units, the daily volume is unlikely to increase as the remaining 14.2 million LP units are owned by the general partner (GP) and do not trade.
The volume is also low because many investors simply do not want an investment that produces a K-1 in their holdings regardless of the opportunity. As one manager told me when I pitched him the idea, “If I put a K-1 in my clients’ accounts, they’ll kill me come tax time.” This is unfortunate, because Ciner operates in Wyoming, a state with no income tax. With no state filing required, its K-1 paperwork is greatly simplified, but many people, once burned by a complicated MLP K-1 never buy a simple one either.
Ciner makes soda ash by mining the sodium rich mineral, trona.
Ciner Wyoming owns and operates a large trona mine in southwest Wyoming. The mine began production in 1964 and as of 2019 still holds 59 years of reserves. From the trona deposits it mines, the company produces soda ash which in turn serves as a building block for making flat glass, container glass, industrial chemicals, detergents, paper, and other consumer and industrial products. As countries develop, their citizens inevitably use more soda ash. Consumption in the U.S. is 34 pounds per capita, while global consumption ex-US is 14 pounds per capita.
Global production of soda ash is approximately 57 million tons. Roughly 17 million of these tons come from trona-based production of which Ciner Wyoming’s share is 2.6 million. The remaining 40 million tons are produced synthetically from raw materials (salt, limestone, ammonia) using the Solvay process as well as Hou’s process in China. Synthetic processing is inherently more expensive than mining because it requires more energy and it creates unwanted byproducts. Synthetic production is dominant because there is insufficient trona production to meet global demand and because plants, unlike mines, can be built close to their end-users to reduce freight costs. There are no synthetic soda ash plants in the United States.
While U.S. demand trends are flat, multiple sources show global trends growing a 2% to 3% annual growth rate out to 2025 for an additional 1 to 1.6 million short tons per year. While some demand growth will be met by adding incremental trona mining, higher-cost synthetic plants will still need to supply roughly 70% of global soda ash demand for years to come as the best located and most-economic trona deposits are already engaged in soda ash production.
Green River Basin Trona deposits
The soda ash reserves in the Green River Basin of Wyoming compose 80-90% of the world’s approximately 25 billion tons of known reserves (USGS 2018). The deposits in Wyoming are the legacy of a fifty-million-year-old, 15,000 square mile, freshwater lake. This body of water, about 75% the size of today’s Lake Michigan, evaporated quickly and repeatedly many times, leaving the sediment from nearby sodium-rich runoff to collect in layers at the lake’s bottom during each evaporation cycle. Today, 85% of U.S. soda ash production is in Wyoming with the remainder coming from solution mining in Searles Valley, California.
Ciner Wyoming mines 4 million tons of trona annually to produce 2.6 million tons of soda ash. The difference is a function of the ore to ash ratio and the purity of the ore. Ciner Wyoming’s ratio of 1.5:10 and 85.8% respectively is indicative of the high quality of the Green River Basin deposits. The deposits are also only 800 and 1100 feet below the surface, or only half the depth of competitors’ mines in the region, and these shallower beds also have less halite impurities as well.
These geologic “gifts” translate into improved economics. From the 2018 10-K,” We have a competitive advantage because we can mine the trona and roof bolt simultaneously on our continuous miner equipment. In addition, the trona in our mining beds has a higher concentration of soda ash as compared to the trona mined at other locations in the Green River Basin, which is typically imbedded or mixed with greater amounts of halite and other impurities. Our trona ore is generally composed of approximately 80% to 89% pure trona.”
The shallower depth and higher quality of the ore, as well as deca rehydration (discussed later), are the three primary factors that allow Ciner Resources LP to operate with fewer employees than its competitors according to the 2018 Annual Report of the State Inspector of Mines of Wyoming.
2018 Wyoming Trona Production & Employment
Operator
Mine
Employees
Production (Tons)
Ciner Wyoming, LLC
Big Island Mine
436
4,002,657
Genesis Alkali, LLC
Genesis Alkali
824
4,224,660
Solvay Chemicals Inc.
Solvay Chemicals Inc.
438
4,550,279
Tata Chemicals (Soda Ash) Partners
Tata Chemicals Mine
527
4,622,233
TOTAL
2,225
17,399,829
Deca Processing is a competitive advantage
Ciner Resources surface land availability and manufacturing process allows for a lower cost method of extracting soda ash from its liquid waste streams than is available to its nearby competitors. This process is called deca rehydration.
From the 2018 10K, “The evaporation stage of our trona ore processing produces a precipitate and natural by-product called deca. “Deca”, short for sodium carbonate decahydrate, is one-part soda ash and ten parts water. Solar evaporation causes deca to crystallize and precipitate to the bottom of the four main surface ponds at our Green River Basin facility. In 2009, we implemented a process called deca rehydration, which enables us to recover soda ash from the deca-rich purged liquor as a by-product of our refining process. We capture the soda ash contained in deca by allowing the deca crystals to evaporate in the sun and separating the dehydrated crystals from the soda ash. We then blend the separated deca crystals with partially processed trona ore at the dissolving stage of our production process. This process enables us to reduce our waste storage needs and convert what is typically a waste product into a usable raw material. “
But the deca rehydration process is also a driver for the new capital work, as the 2018 10K states, “Our deca stockpiles will substantially depleted by 2023 and our production rates will decline approximately 200,000 short tons per year if we do not make further investments.” [This would be a 7.5% decline on 2,600,000 short tons/year].
This bombshell was mentioned for the first time in the 2018 10K issued in March 2019. Either management intentionally withheld this information previously, was ignorant of their overproduction, or in the best case, they thought the overharvesting would be at a lower, non-material rate of decline. Whichever the cause, I like to admit my mistakes early before they grow larger. In a perfect world my CEO’s would do the same, unlike how this unfolded.
Growing production to 3.5 million short tons
The new capital project aims to not only make up the deca shortfall but increase production to 3.5 million short tons annually as well. Previous debottlenecking investments since Ciner took over from OCI, aimed to raise production to 3 million short tons by making incremental upgrades to existing facilities, but these efforts only succeeded in maintaining production. This project will instead add a new processing line on the surface and below ground to raise production by a third.
The expansion project cost is estimated up to $400 million and includes $50 million for an electricity/steam cogeneration facility initiated, and partially funded, in 2018. This new source of electricity and heat will provide roughly one-third of the site’s electricity needs by year end 2019. Once fully operational, the savings in electricity spend will increase EBITDA by $7-10 million annually beginning 2020. The corporate parent, Ciner Group, is experienced in this space by building and operating the two largest cogeneration plants in Turkey.
To fund the capital project, half the cost of the expansion will be paid by the distribution cut and half will come from debt. Current debt financing uses a variable rate but was 4.1% after hedges in 2018. The cogeneration savings previously mentioned could cover much of the interest expense of the additional 200 million in debt until the production increase is realized.
Green River Basin shipping costs
Ciner Wyoming ships over 93% of its product by rail, either to domestic customers in North America or for international customers through ports in Portland, Oregon and Port Arthur, Texas. Prices for domestic sales include shipping to the customer but for international sales are only to the port f.o.b. Ciner Wyoming’s export markets are heavily influenced by shipping cost as soda ash is a bulky commodity. In 2017 and 2018, freight charges were 29% of sales.
Rise of Turkey in the Soda Ash market
The United States dominates global soda ash reserves with 23 billion short tons of known reserves. Second place belongs to Turkey with 1-2 billion and Botswana at third with 400 million. While Turkey’s reserves are much smaller than those in the U.S., they are still meaningful and well-located for serving the European market from the Turkish port of Derince only 150 miles away from the mines. In 2018, soda ash from Turkey was shipped to the east coast of the United States for less than the cost of shipping soda ash by rail from Wyoming.
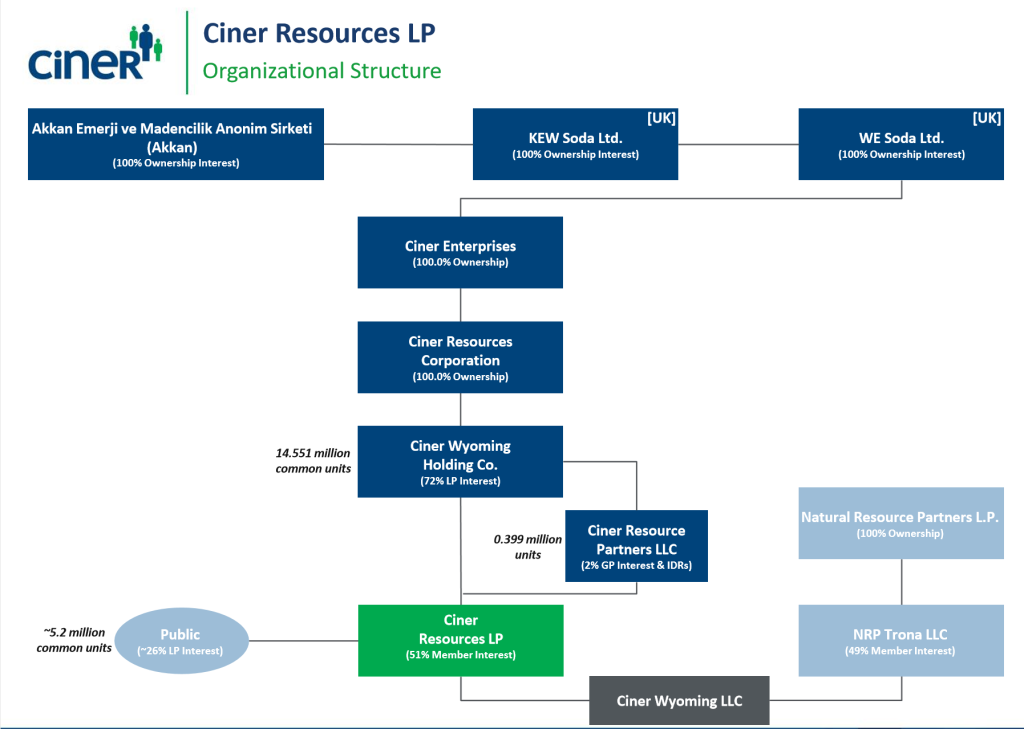
Ciner group, a large Turkish conglomerate with interests in energy, mining, chemicals, and shipping, also owns a string of holding companies that ultimately owns Ciner Resources Partners LLC, the general partner (GP) of Ciner Resources LP, in the United States. Ciner Group also owns the Eti Soda and the Kazan Soda mines in Turkey.
The new Kazan mine brought an additional two million annual tons of soda ash online using trona solution mining beginning in 2018. The market absorbed this increase without a noticeable impact on pricing with most of its exports going to nearby European markets.
Ciner Resources LP Ownership
Ciner Group bought 72% of Ciner Resources LP and 100% of its GP in November 2015 from OCI Resources for $450 million. The purchase of the 2.6 million short ton production in Wyoming, combined with its 4-million tons of production in Turkey makes Ciner Group the largest producer of soda ash worldwide.
Natural Resource Partners LP (NRP) stake
NRP bought a 49% stake in OCI Wyoming, Ciner Wyoming’s predecessor, from Anadarko in 2013 for $293 million. Last year, NRP received $46.5 million in cash distributions from Ciner Wyoming and $49 million in 2017. NRP owns a non-controlling 49% stake in Ciner Wyoming LLC and gets to appoint three of the seven members to the board of directors. Ciner Resources has first right of refusal on any sale of the NRP’s stake and vice versa.
NRP also agreed in 2013 to pay up to $50 million in earn-outs to Anadarko if OCI Wyoming reached specified targets for the following three years. While NRP paid Anadarko $11.5 million in earn-outs, but Anadarko is suing NRP for an additional 40 million in an accounting dispute over the remainder. The outcome of this lawsuit is between NRP and Anadarko and will not affect Ciner Wyoming.
Ciner Group Growth Strategy
Ciner Group is “Dünyanin En Büyük Üreticisi”, the world’s largest manufacturer of soda ash.
Light blue columns are mined soda, brown columns are synthetic production. Source: Cinergroup.com.tr
Ciner Group growth and sales strategy
Given Ciner Group’s low trona-based production cost in Turkey and the low cost of ocean shipping, its product is almost always cheaper than using soda ash made from synthetic production to most ports in EMEA and the Americas. Likewise, their U.S. company, Ciner Resources possesses many of the same advantages when shipping its trona-based soda ash production to North America and the South East Asian markets.
Scuttlebutt in the press is that Ciner Group may open additional Turkish trona capacity in the future, but at a minimum it would take several years to bring a greenfield operation online. Even then, with global markets growing demand by 1 million short tons per year, additional Turkish capacity or capacity upgrades in the Green River Basin from Ciner Resources and its competitor should not have trouble finding customers.
In June 2019, Şişecam Group, a large glass manufacture and synthetic soda ash producer, signed an equal production partnership contract with Ciner Group for the natural soda production in the US. This new project will have an annual natural soda production of 2.5 million tons as well as 200,000 tons of sodium bicarbonate. It is to be financed with a long-term project loan for 80% with the balance covered by equity capital invested equally. Unlike Ciner Resource’s mine, the new operation would use the solution mining technique Ciner uses at its Kazan operation to extract the trona by dissolving it underground and removing the soda ash above ground. Advances in horizontal drilling have increased the efficiency of this technology from earlier solution mining processes.
My guess is the greenfield investment is related to Ciner Group’s, new “Imperial Trona” subsidiary which is in the permitting process to mine lands with sodium assets about 40 miles south of Ciner Wyoming’s current facility. The application is currently under review by the Bureau of Land Management. So far, all the public comments for the application and its potential for new mining jobs are favorable.
Exiting ANSAC
Currently, international sales, marketing, and logistics from the Green River Basin producers, Genesis Alkali, Tata Chemicals and Ciner Resources Corporation, are managed by the American Natural Soda Ash Corporation. ANSAC is a cooperative created and run for the benefit of the participant companies. Each participant sells its products for the international markets to ANSAC which pools the product and returns the sales proceeds less expenses pro-rata. ANSAC’s primarily serves Latin America and Asia. Europe considers ANSAC a cartel more than a cooperative and correspondingly prohibits it from selling into the European Union.
In November 2018, Ciner Resources gave notice that it will exit the consortium on Dec 31, 2021. Ciner Resources plans to use Ciner Groups sales, marketing and logistics after this date. The combination of Ciner Resources and Ciner Group volumes will make Ciner the largest exporter of soda ash globally. Ciner Resources expects this leverage will eventually lower its cost position and improve its ability to optimize market share both domestically and internationally. In some cases, such as Ciner Group developing exclusive modern port facilities in Port Longview, WA and in North Carolina for Ciner affiliates to utilize, I tend to agree.
However, there will always be an inherent conflict of interest when Ciner group selects customer shipments for its 74%-100% owned ventures vs its 51% Ciner Resources holding. But eventually, Ciner Resources LP will hit the upper end of its incentive distribution rights threshold and the math could change to favoring Ciner Wyoming sales in five years.
CEO turnover
After a twenty-year career, the last ten as CEO, with Ciner Resources and its predecessor, OCI Chemical, Kirk Milling, resigned suddenly on June 17, 2019 and was replaced by Oğuz Erka, on one day’s notice. Mr. Milling also received a one-million-dollar separation agreement which included a non-compete agreement. He wrote a positive exit letter praising the current plan and Mr. Erka which is not surprising considering his large severance.
There is little public information about Mr. Erka. He was the Director of International Operations & Coordination at parent company, Ciner Enterprises, prior to taking his new assignment. He is 41 and holds a bachelor’s degree in marketing and international business from Northwest Missouri State University. Ciner Group also sponsors the Kasimpasa football team in Turkey where Mr. Erkan serves as a director. Let’s hope this is more of a networking opportunity and chance to take pictures with footballers than a business distraction. He is also president of Imperial Trona, a new Ciner Enterprises entity, that in 2018 applied for a sodium mining lease in southwest Wyoming and is another indication of Ciner Group’s soda ash growth through trona mining strategy which he helped develop.
Operationally, the Deca shortfall surprise this year and the failure of previous efforts to increase production through debottlenecking the facility the past five years did not bode well for Mr. Milling’s tenure. Mostly likely though, it was only a matter of time before a Ciner Group executive took over the Ciner Resources CEO position.
Incentive Distribution Rights Agreement
The general partnership agreement provides for Ciner Resources LP to pay an Incentive Distribution Rights (IDR) to the General Partner once the quarterly distribution exceeds $.50/quarter. This level is substantially above the current $.34/quarter rate. While the rate starts low at 2%, it then jumps quickly in three steps to 50% at $.75/quarter.
Total Quarterly Distribution per UnitTarget Amount
Marginal Percentage Interest in Distributions
Unitholders
General Partner
above $0.5000 up to $0.5750
98%
2%
above $0.5750 up to $0.6250
85%
15%
above $0.6250 up to $0.7500
75%
25%
above $0.7500
50.0
50%
While I strongly dislike paying IDR’s, they do incentivize a GP to grow the distributions. My investment horizon for CINR ends with a nice capital gain well before the IDR hits 50%.
Risks – Global Recession
Soda ash prices would decline in a global recession as glass demand in construction and autos would certainly glass drop as well. A 20% drop in the sales price revenue at current production rates and costs would take Ciner Resources’ operating income to zero. But that is overly simplistic, as Ciner uses annual contracted prices which are less variable and production inputs such as shipping, and energy costs would decrease in a recession. Most importantly, the impact of steep decline in prices would be more severe on higher cost synthetic producers who eventually cut production. Ciner Resources’ predecessor stayed profitable and remained at full production throughout 2008-2009.
Risk – Project overruns
Many large industrial and mining projects run over budget and time estimates. I would expect Ciner to encounter some unforeseen challenges as well. A strong mitigating factor in Ciner Resources’ favor is that the Green River Basin is an extremely well defined, low risk area from which to mine trona and the company is well experienced with operating the trona to soda ash processing operations. Furthermore, Ciner group is experienced having recently built out the Kazan mine and processing facility from 2015-18. The Kazan plant was built in about three years or roughly six months over the original projection.
Risk – Lack of Governance
When investing in MLPs, lack of governance is just the reality of a LP/GP structure. One must decide before investing in the LP, if the General Partner’s owners have enough skin in the game at the LP level to profit from its success as well. In Ciner Resource LP’s case, Ciner Group’s 72% ownership of the LP and the opportunity to collect IDR’s by growing the distribution are enough for me, but I’ve listed some of the governance risks below for those don’t regularly invest in MLPs.
The GP is difficult to replace. The GP cannot be replaced with less than a two-thirds majority of the LP’s, and Ciner own 72% of the LP units. Even with a two-thirds majority, removal is not immediate.
Conflict of interest. From the 10-K, “Ciner Enterprises and other affiliates of our general partner are not restricted in their ability to compete with us.”
Take-under risk. If the GP should own 80% of the LP’s units, it may buyout the remaining minority unit holders based on recent prices at the time it chooses to do so.
Risk – Single Facility risk
Ciner Wyoing operates out of a single facility and is subject to unexpected mine issues, natural disasters, and other rare, but non-zero events. Management does carry an unspecified amount of insurance on the business. Mine safety 2016 extended outage
Risk – ANSAC termination
Ciner Resources withdrawal from the ANSAC sales cooperative on December 31, 2021 will introduce a risk during the transition period from ANSAC to Ciner Group for international sales. I would expect that it is more likely that some sales get delayed or are offered at lower prices to win new business than that the transition occurs without any issues.
Ciner Resources is also likely to have less influence in ANSAC than previously now that it has given its termination notice.
Risk – Environmental
Self-bonding. Ciner Wyoming’s principal mine permit issued by the Wyoming Land Quality Division requires a “self-bond” for the estimated future cost to reclaim the area of our processing facility, surface pond complex and on-site sanitary landfill. As of December 31, 2018, the amount of the self-bond was $32.9 million but this estimate is subject to periodic re-evaluation by the Land Quality Division. The recent coal company bankruptcies in Wyoming have raised attention in the state legislature as to whether self-bonding is an appropriate mechanism for assuring remediation is completed at a mine’s termination. A state law change in the self-bonding policy to require third party bonding would increase costs.
Ciner Resources LP Capitalization, (millions except $ per unit data)
Total LP + GP Units =
20.1
Market Price =
$15.75/unit
Market Cap =
317
Cash (6/30/19)
9.4
Long Term Debt (6/30/19)
145.5
Enterprise Value
453
EBITDA (TTM)
132
Financials
($ in millions, except per unit data)
2019
1st half
2018
2017
2016
2015
2014
Soda ash produced (thousand short tons)
1353
2613
2667
2695
2663
2544
Net sales
260.2
486.7
497.3
475.2
486.4
465.0
Cost of products sold including freight costs
180.8
355.0
356.7
335.6
332.4
325.3
Net income
49.0
103.0
86.4
86.3
106.2
91.9
Net income attributable to non-controlling interest
25.4
53.1
44.8
44.9
54.7
47.4
Net income attributable to Ciner Resources LP
23.6
49.9
41.6
41.4
51.5
44.5
Distributable cash flow
29.5
58.4
52.0
50.4
56.8
53.5
Cash distribution declared per unit
$0.68
$2.27
$2.27
$2.27
$2.19
$2.06
Distribution coverage ratio
2.15
1.28
1.14
1.10
1.27
1.29
Adjusted EBITDA
66.0
136.5
120.1
116.5
133.9
120.5
The above financials include Ciner Wyoming receiving a one-time royalty settlement in June 2018 for $27.5 million. ($14 million net to Ciner Resources LP).
This fall I was in Chicago for the MicroCap club‘s “MicroCap Leadership Summit”. The first day of the conference consists of investing presentations by guest speakers and fellow attendees, and the second day is a series of round robin interviews of 20 microcap company’s CEOs and came away with a few ideas worth further investigation.
As a bonus, I also met Robert Kraft Jr. of StockNewsNow who runs the “PlanetMicroCap” podcast. I mentioned to him that I had just listened to his podcast that morning while exercising and before you know it, he’s asking me if I want to be on the podcast.
Robert plays up the fact that I like illiquidity. Just to be clear, all things being equal, I strongly prefer liquid stocks over illiquid ones, but all things are never equal. Given the chance to buy for the long-term, a mispriced stock that no one has heard of that trades on low volume or the chance to buy a richly valued stock of a company in everyone’s newsfeed that trades on high volume, I’ll take the unknown, albeit illiquid, stock every time.
Lastly, while in Chicago, I spent the day before the conference visiting a couple Frank Lloyd Wright homes. Seriously, when you fly into O’Hare you are only minutes from his first home and studio in Oak Park, Il as well as all the homes he designed in the adjacent neighborhood. If you’ve never visited a Wright home, I bet you’ll be surprised with how modern a 100 year old house can look.
Viper Energy Partners (NASD:VNOM) is a three-year-old Master Limited Partnership (MLP) that owns oil and gas royalties in the Permian Basin of West Texas. Backed by a strong shale oil exploration and production partner, Diamondback Energy (NASD:FANG), Viper possesses good visibility to increase its cash distributions 25-30% over the next two years while paying out a 7% distribution along the way as it continues to purchase more royalty stakes from its general partner and third parties in West Texas. While I am generally bearish on holding MLPs as long-term investments, I find Viper’s risk/reward attractive for the next year or two as its growth story plays out.
First, I need to apologize for writing about another MLP, as I do not like MLPs. Its just that every year or two, I do seem to find one that is relatively low risk with a meaningful reward such as last year’s PennTex Midstream Partners. So onward I go, but first I feel compelled to rehash some of the structural problems with MLPs.
Once upon a time, MLPs used to only own long-life, irreplaceable assets like interstate pipelines operated under long-term take or pay contracts with significant tax shielding depreciation that easily exceeded the pipeline’s maintenance requirements. This was all done under a partnership structure to avoid corporate income tax. Even better, unlike a fixed bond, classic MLPs held the potential for increased distributions over time as pipeline contracts are adjusted for inflation. Additionally, the nature of a pipeline system also provides opportunities for increased throughput and extensions. Yes, those were the good old days, back when MLPs owned real assets, and you could safely buy and hold.
Of course, MLPs were never really that great. Unlike the owners of common stock, limited partners in a MLP, own “units” not “shares” and have no shareholder rights at all. You must never forget that the “L” in MLP stands for limited. MLPs are not accountable to unitholders, but are managed by the general partner who holds all the cards and often collects excessive incentive fees at the limited partners expense. As a limited partner, you truly have no say in any matters of significance – honest, its says as much about 20 times in the 10-K. Don’t wait for an activist investor to show up and rescue you in an MLP, that’s not going to happen. There simply is no such thing as an activist limited partner. You just own “units” which are entitled to a proportional share of the available cash should the general partner care to distribute it, but you do not own a proportional share of the company.
Furthermore, owning an MLP with assets in 20-30 states means you pick up the responsibility to potentially file state income taxes in 20-30 states each spring. Did I say spring? I meant to say summer because you will likely get your K-1 forms late, so you will need to extend your filing date.
And what exactly does your partnership own? Does it possess an irreplaceable asset like the Colonial Pipeline running from Houston to New Jersey with dual 40” pipes buried in no longer obtainable right of way or do you have an asset that like an oil well that simultaneously reduces its reserves by one barrel for every barrel of oil it produces?
Its these later MLPs which own wasting assets that are most problematic. I wouldn’t say Ponzi scheme, at least in front of a lawyer, but I would say that when an MLP has to continually replace wasting assets with new assets, trouble eventually ensues somewhere down the line. Usually, the process is manageable at the beginning when the MLP is new, but it is as its asset base grows ever larger, the trick is harder to pull off. I am reminded of the circus act with the spinning plates, and even the best talent can’t keep all the plates spinning forever (See: Kinder Morgan dividend cut).
Lastly, you are buying an income producing asset whose price is intrinsically tied to interest rates, and the last time I checked, interest rates are inching up. Yes, its a real slow increase, but it’s upwards all the same, and investing, like sailing, is a lot more fun with the wind at your back.
But of course, it is precisely the hated qualities that create the opportunity. It’s the MLP’s tax restrictions which limit their ownership to individuals and away from large institutions. It’s their low liquidity which effectively prohibits large firms from buying the undervalued units while also exaggerating the downside effect of the occasional large sales that do occur. Or the tax filling challenges themselves probably lead many folks to say never again after they receive their first K-1, and the oddball nature of the sector further which can’t help but reduce investor awareness interest as well.
Combined, these problems reduce market efficiency and create mispricing for you and me. Sure, all things equal, I’d rather buy something without these issues, but many of my best purchases come not from buying what others don’t want to buy, but from buying what others would like to buy, but can’t for technical reasons.
So, let’s talk about why some of these technical issues that don’t apply to Venom Energy Partners. First, all of its assets are located in the state of Texas which doesn’t have a state income tax, so no special tax filing is required. True, the partnership may establish operations across the state line in New Mexico someday, but I can deal with one or two states’ filing requirements, its MLPs like Enterprise Partners with filing requirements in 35+ states that gives me nightmares.
Second, the general partner of Viper Energy does not charge an incentive distribution rights (IDR) management fee. To say this is unusual is an understatement, but it is came about because Venom Energy was primarily brought into existance to finance Diamondback Energy’s drilling program. By buying a royalty, Viper is effectively is buying part of Diamondback’s future production to fund Diamondback’s drilling program. This is similar to Taco Bell selling its physical stores to a real estate investment trust, leasing those stores back and using the freed up capital to build new ones. Oil wells, tacos, whatever; capital will find its highest use.
Currently Diamondback owns over 70% of the shares of Venom. Since Diamondback is still using Venom to raise funds, it is in Diamondback’s best interest to keep Viper’s expenses reasonable. Someday down the road, Diamondback’s interest in Viper will be much lower and the temptation to raise fees and turn Viper into a piggy bank will become irresistible, but we are a few years off from that for now.
Third, is that Diamondback’s CEO and CFO own just about as much Venom stock as they do Diamondback stock. Nothing gives me greater comfort than knowing that the CEO and CFO combined own over 20 million (one million shares @$20/share) reasons not to sacrifice Venom Energy Partners for the benefit of Diamondback.
Lastly, when I buy the occasional MLP, I strongly prefer ones that are trading down from their initial public offering (IPO) date for a couple reasons. For starters, I don’t want to pay the seven percent underwriter fees for the IPO and when the hype is the loudest. The best time is while they are still small enough to have a good runaway of accretive transactions. Many new MLP’s really do have reasonable growth plans at their start, its five to ten years later when the IDR fees become so large that trouble begins. Its then that the MLP can no longer make new acquisitions below the cost of its capital, growth stalls, investors demand higher yields further increasing the cost of capital, a vicious cycle begins the dividend gets cut and limited partners become bag holders.
Ok, that’s enough ragging on MLPs, it’s time to actually talk about what Viper actually does. Viper owns royalty interests in currently and future producing oil and gas wells in the Permian Basin of West Texas. Before an Exploration and Production (E&P) company like Diamondback Energy can drill a well, they must obtain lease rights to drills from the mineral right’s owners. In return, Diamondback pays a royalty to on all oil and gas production produced and sold. The royalty owner has no expenses other than taxes, no drilling costs or operating expenses. The royalty owner simply collects a check from the operator every month the well produces whether the operator makes money or not. Being a royalty owner is a definitely a good thing, but some people like don’t like to wait, so they sell their future royalties to third parties in exchange for a lump sum.
In fact, the only bad thing about being a royalty owner is that for every barrel of oil produced on your leasehold, the number of barrels left to be produced is, by definition, reduced by one. This is a little detail often overlooked by retail investors. You’ve really got to think of your distribution as part income, part return of capital because the asset you own isn’t going to produce forever.
Over the life of an oil well, its highest production is achieved on its first day. It declines rapidly at first and then more slowly, until many years later, the well produces less oil than it costs to operate it. At that point, the well is plugged and the royalty checks stop. Depending on the oil field, cumulative production in the first year or two could easily exceed all the production extracted over the next twenty. From the net present value perspective, getting your production back early is almost always economically advantageous. However, early paybacks also mean that if you don’t have a steady stream of new wells coming online, your royalty income will decline as your production naturally declines. Fortunately, for Viper, they have 250+ well sites left to be drilled compared to 786 wells currently in operation, which will push off the day of reckoning for a few years. In addition, their properties are in the Delaware and Midland Basins of West Texas where stacked plays are common. This means that there may be several oil and gas reservoirs located vertically under a single surface location (think free option), though some of the lessor reservoirs may not be viable for drilling at current prices.
To keep feeding the MLP so future distributions can grow, new royalties need to be purchased to replace the depleting production from older wells. Currently, Viper is successfully doing this. Diamondback has enough dropdown candidates lined up for Viper to acquire that the next few years to keep production rising and distributions increasing. But will they able to continue growing from a larger asset base, ten years from now?
I don’t know and fortunately, it is not critical to my investment thesis. Simply put, I only want to own Viper in its early growth stage, when the partnership’s goals are more manageable. I leave the riskier long-term ownership to yield hog investors who don’t appreciate the challenges of growing a depleting asset. (See red queen problem).
Risks:
I own an asset with the plan to sell it before others who own it realize that it can’t grow forever. Yes, I know this means I am speculating more than I am investing, but I am doing so with my eyes wide open.
Oil Prices
Obviously, a drop in the price of oil would immediately translate into lower cash distributions just like an increase would raise them. But a royalty owner, unlike a producer, doesn’t get impacted as severly. A drop-in oil prices from $50 to $49/bbl, will reduce a royalty owner’s income by 2%, but for an E&P company with $40/bbl in operating expenses, the same one dollar drop in oil prices will result in a 20% reduction in net profit.
I expect oil prices to drift in their current range until a little more global inventory is worked off, a geopolitical event occurs, or we have a recession. If I only knew which scenario would happen first, I could make a much more accurate prediction! If you really do know what the price of oil will be next year, I suggest skipping the rest of this post, and suggest you just buy oil futures on the NY Mercantile instead.
Cutesy Tickers
My track record of owning companies with cute ticker names like VNOM and FANG is mixed. Sometimes it means the company is owned by a maverick with an independent streak, but other times it signals a promoter. I put FANG and Diamondback into the independent streak, but I still prefer boring names and dull tickers for reducing the odds of a getting snake-bit.
Lack of detailed information on the royalty terms and locations
The information in the Viper 10-K and investor presentations are summarized data. Limited partners will never know in detail what Viper owns and what the terms are for most of its leases. For instance, you’ll get a pretty map of where leases are located but it won’t tell you if that dot on the map represents a 1% royalty interest or 12.5%. Until the next 10-K, we lack updated reserve information for the most recent acquisitions.
At a certain point, you basically just have to trust the management which is easier to do when like Viper, management owns a meaningful stake. So far, I haven’t come across anything suspect in my research that would lead to doubt them, but I do think their investor materials are best read with a critical eye. For example, management compares Viper’s cash margins and operating expenses to 20 E&P companies in the Permian. Of course, Viper’s numbers kick butt – a royalty owner it doesn’t have any operating expenses besides taxes and management salaries, it would be a scandal if its margins weren’t higher.
Or take a look at management’s presentation on distributions (below) and see the distributions going up in a nice smooth line. Of course, the distribution bars are always going up, they are plotting cumulative distributions!
Here is my look at the same quarterly distributions. In my chart, they still trend up, but the inherent volatility of owning mineral royalties is much more apparent.
In fairness, the company presented the actual quarterly numbers more reasonably in the “Significant Future Growth Trajectory” slide.
This slide highlights the short-term opportunity for me, but also the long-term risk. Viper has royalty positions on enough undrilled property and likely dropdown acquisitions to realize these projections in the near term, but what happens 5-10 years from now? Where will the production come from to replace the production lost as the wells deplete over time? As production increases, so does the amount of oil that needs to be replaced from depletion. The challenge just gets harder as the asset base gets bigger. Eventually, the gap can’t be filled, growth slows or reverses, distributions get cut and the limited partners find themselves holding a declining asset.
Competitors
Blackstone Minerals (BSM) operates in the same oil and gas minerals royalty space and yields roughly the same but is diversified across many more geographies. While diversification is usually a good thing, I prefer the much narrow scope of Viper in the Permian Basin where break-even costs are lower for E&P companies. One of the risks of holding an oil lease royalty is that your E&P operator will chose to drill wells elsewhere rather than on your property. Since, drilling for oil in the Permian is more profitable than anywhere else in the U.S. right now, I prefer keeping all my eggs in the prettiest basket.
When to buy:
Well a couple weeks ago would have been good, like back when I started writing the post, but don’t worry, you will probably have another opportunity to buy lower in the future as well. MLPs raise capital to fund acquisitions by selling new shares. (My hate of dilution is one more reason not to buy a MLP). To sell these large blocks of new stock, Viper will have to offer a 10-15% discount to the current stock price to attract large institutional buyers. Some of these buyers will then turn around and flip the shares for a quick buck. By all means, if you suspect a secondary offering is being planned, wait to buy until the price drops on the news.
When to sell:
A great reason to sell an investment held by yield seekers is when the future gets murky. Should Diamondback slow down its land acquisitions and drilling, Viper’s most visible growth path would slow down as well. Another reason to sell is when the asset base gets significantly larger and growth becomes mathematically challenging. Currently, Viper has a market cap of 2.5 billion. I will likely sell around a 3.5-4.5 billion market cap because I want to be out of the company before it becomes difficult to find enough future acquisitions at attractive prices to feed the growth beast. Until then, I like the risk/reward.
I just had my first podcast interview ever and I say “Turn the drill bit to the left” Left??? Really, I said left? Was I on drugs? There is nothing that will turn your brain into mush faster than being worried about saying “um” and “ah”. Oh well, at least I didn’t say “um right”.
The interview came about because after I met Eric Schleien at the Berkshire AGM this year. I mentioned that I enjoyed his podcasts (https://intelligentinvesting.podbean.com/) and then after twenty minutes spent chatting about microcap stocks, he’s inviting me on his show.
Last week, I talked with Eric Schleien again for the podcast. We discussed two of my favorites, Contura Energy (CNTE) and Hostess Brands (TWNK), but frankly his Travis Wiedower and Geoff Gannon interviews make for much better listening.
As I mention in the podcast, “Turn the drill bit to the right” was one of the late CEO of Contango Oil and Gas, Kenneth Peak’s, favorite things to say. Because as Ken saw it, virtually all the exploration and production industry’s value creation occurs through the drilling of successful exploration wells, and if you’re going to drill that successful exploration well, then you need to turn the drill bit to the right to actually make the hole and prove your idea right or wrong.
Ken was also one of a kind, he not only named his largest field discovery after his parents, he also once named a set of three exploration wells after The Big Lebowski’s protagonist: the prospects Dude, His Dudeness and El Duderino. He was anything but ordinary.
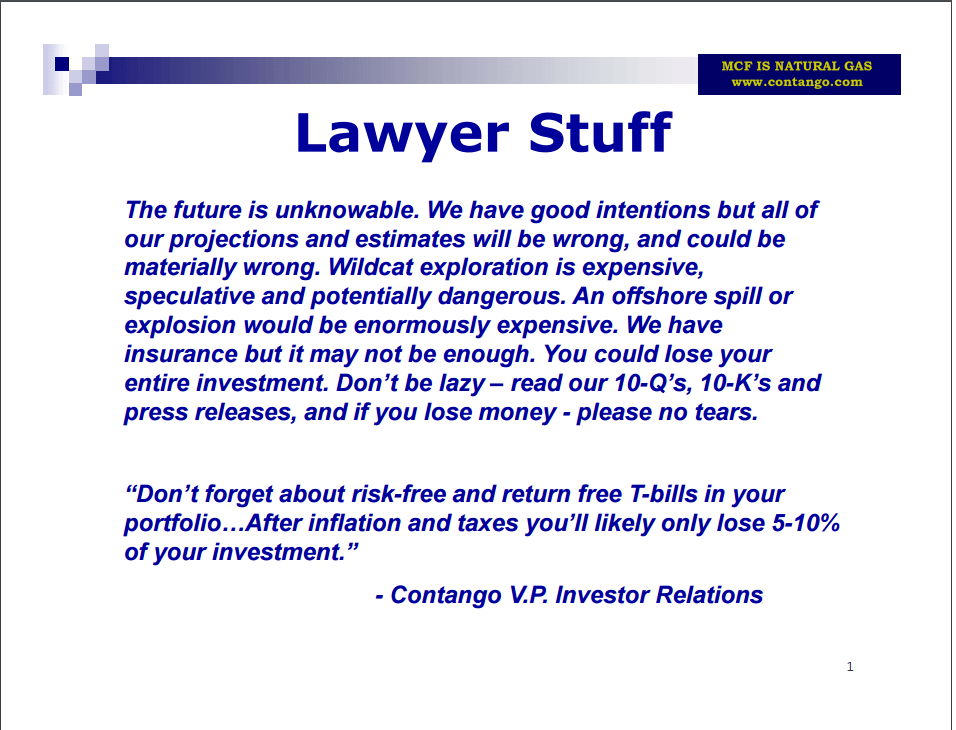
I will close this post with my favorite example of his non-traditional thinking from this August 2012 investment disclaimer slide.
Contango Oil and Gas August 2012 Investment Presentation
Not sure which mutual fund to buy? You might want to consider the mutual fund manager instead.
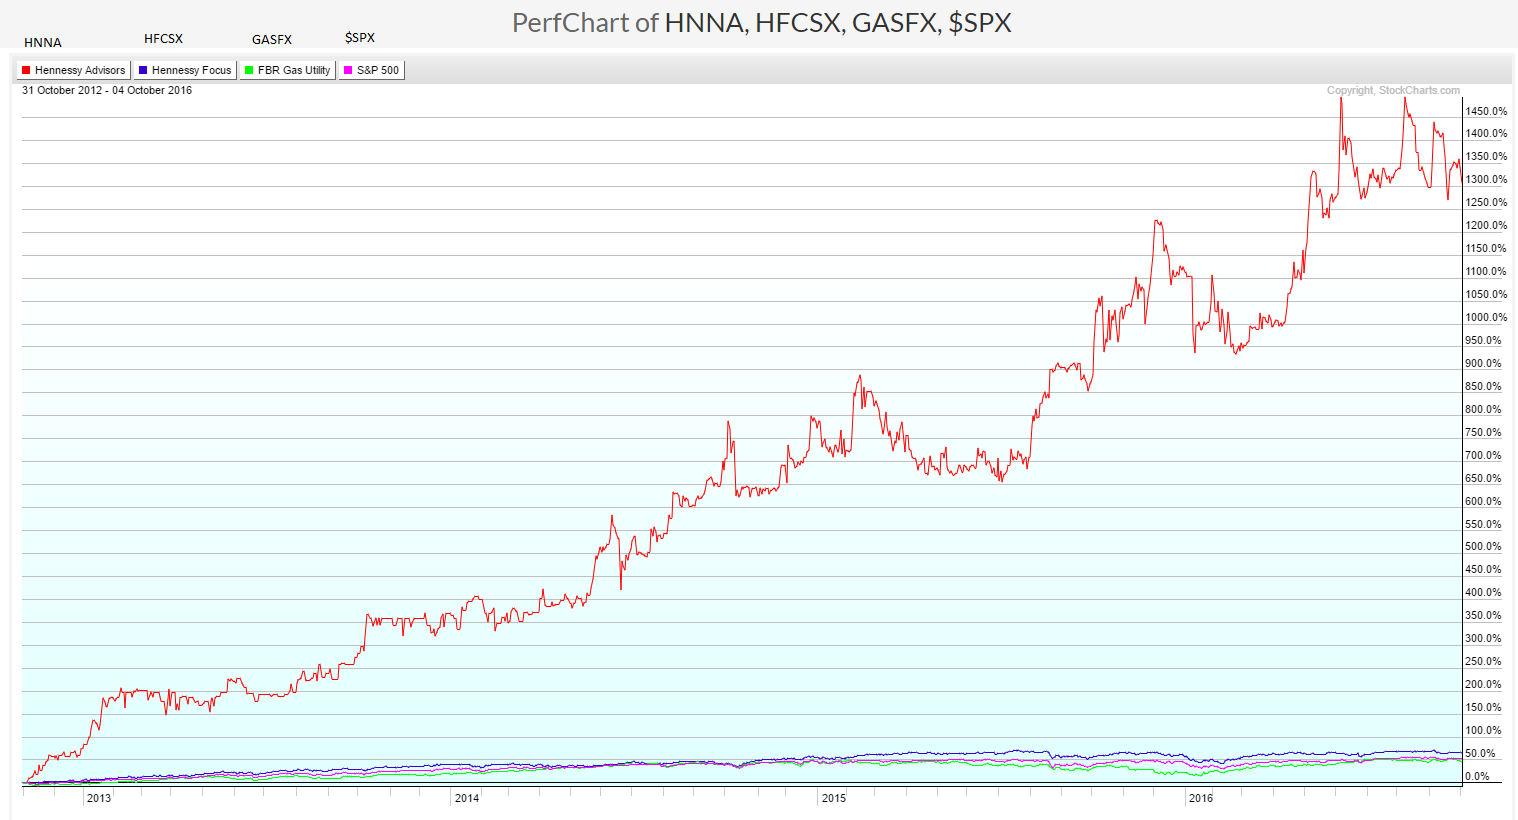
Hennessy Advisors (HNNA), the red line in the above chart, is a publicly traded stock mutual fund manager. The other lines represent its two largest mutual funds as well as the SP500. Any questions?
In rising markets, its almost axiomatic that an investment in a mutual fund management company will be more profitable than an investment in any of its mutual funds. (The inverse is mostly true as well). For an investment advisor, revenue is proportional to the quantity of assets under management while expenses are not, so the mutual fund management business becomes immensely profitable in rising markets with pretax margins approaching 45% in the case of Hennessy.
Mutual Fund manager Hennessy Advisors (HNNA) is a tiny, overlooked player in the investment advisor business with 16 open ended mutual funds holding combined assets under management (AUM) of 6.6 billion. The company started its first mutual fund in 1996 focused on quantitative factors. Later, the company added a broader range of more traditional equity funds through acquisitions for other fund companies. Today, over 70% of its assets are less than five years old with the largest jump resulting from the purchase of FBR’s mutual funds in 2012. More recently, on September 23, 2016, the company obtained 440 million in new assets from the Westport fund management company growing AUM by an additional 7%. Due to the advantages of scale in the mutual fund industry, earnings from the acquisition should increase by a slightly higher amount, say 8-10%.
Hennessy is currently priced substantially below its peers based on its current earnings trend. Due to the company’s small size (174 million market cap), fund concentration and low liquidity, a discount to peers of 10 – 25% would be reasonable, but the current 50% discount seems excessive especially in light of the recent Westport transaction.
To acquire Westport, the company paid 1.75% of the 646 million in assets at the time of the agreement or 11.3 million, even though it appears that only 440 million in assets remained in the fund by the time the transaction completed. [edit – I originally wrote that the purchase price was based on assets at close date, but actually it was based on AUM at agreement date – my mistake]. The assets were merged into the Hennessy Cornerstone Mid Cap 30 Fund which will charge 1.0% of fund assets annually (4.4 million) for fund expenses and shareholder services. With less than a three year payback, this acquisition should yield strong returns, but that’s only if most of the customers’ funds remain with Hennessy.
In the bull case, the clients who own the Westport funds will appreciate the lower fees and better record of the Mid Cap 30 Fund and want to stay. Additionally the transaction preserves continuing fund holders tax basis, while creating a tax liability for those who chose to sell instead of stay. But, Hennessy’s record for keeping assets is stronger when they retain the existing fund using a sub-advisor than when they merge, so the move for higher fees may raise asset flight.
Lastly, the acquisition of mutual fund companies creates an accounting asset on the acquirer’s balance sheet that gets amortized over time increasing cash earnings. In 2016, the company will record a deferred tax asset of approximately 2 million due to amortization so cash earnings are about 8% higher than reported earnings.
Risks:
Market Sensitivity: Hennessy’s fee generation is directly tied to market performance and fund holder retention. While no one complains about this in the good times, in a down market not only will the value of the funds’ assets drop, but the lower prices will also scare investors into redeeming their shares dropping AUM even further. This is why leveraged companies do and should sell at discounts.
Concentration Risk: The Hennessy Focus Fund (HFCSX) is Hennessy’s largest fund with 2.4 billion or 36% of all Hennessy assets under management. Morningstar gives the fund a five star rating a special Bronze star analyst rating. The second largest fund with 1.46 billion or 22% of AUM is the Hennessy Gas Utility (GASFX) Fund with four stars from Morningstar. For those counting, 58% of the assets are in just two funds. As these funds go, so goes the bottom line of Hennessy Advisors.
Management Compensation: The CEO, Bill Hennessy, is also the founder and largest owner with 30% of the shares outstanding. In 2014, he made a sweetheart contract for his services and collects 10% of the net profits each year.
Mr. Hennessy is entitled to receive a quarterly incentive-based bonus in the amount of 10% of the company’s pre-tax profits for each fiscal quarter, as computed for financial reporting purposes in accordance with accounting principles generally accepted in the United States of America, except that pre-tax profit is computed without regard to (A) bonuses payable to employees (including related payroll tax expenses) for the fiscal year, (B) depreciation expense, (C) amortization expense, (D) compensation expense related to restricted stock units (or other stock-based compensation expense) and (E) asset impairment charges (such amount, for each quarter, the “Quarterly Bonus”).
Wow, nice work if you can get it! Fortunately, his ownership stake is 18 times greater than his his 3.3 million compensation in 2015, so he is still well motivated to build shareholder wealth. His leadership team is also highly paid with his CFO and Executive Vice President making $1.3 and $1.0 million in 2015 as well.
Neil Hennessy is only 58 and show no signs of selling the company. Eventually, when the company does get sold years from now, the acquirer will likely already have a President, CFO, and EVP, so the 5.6 million in bonus and salary can be eliminated which will increase the value of the company six to eight times that amount over its worth as an ongoing investment with the extra salary.
A look at some numbers:
Share Count (Diluted)
5,154,094
Price
34
Earnings for TTM:
$2.67
PE
12.7
Earnings as 4 times last quarter
$3.04
PE
11.2
Earnings with last quarter annualized + 6% earnings increase for Westport acquisition
$3.22
PE
10.6
MV (millions)
175.2
Debt (millions)
27.0
Net Cash after Westport (millions)
.4
EV
201.8
2016 Second Quarter Numbers
Operating Income Q2 2016 (millions)
6.1
Interest (millions)
0.1
Taxes (millions)
2.0
Depreciation (millions)
0.3
Amoratization (Deferred Income Tax)
0.5
EBITDA for Q2 2016 (millions)
8.9
Annualized Ebitda
35.8
EV/EBITDA
5.6
Comparable Companies: While Hennessy does not have any publicly traded micro cap peers, larger investment managers in the 2.5 to 8 billion market capitalization range like Janus Capital (JNS), Federated Investors (FII), Legg Mason (LM), Eaton Vance (EV), and Affiliated Managers Group (AMG) have P/E ratios for 15-18 compared to 11 for HNNA. While P/E’s are easily manipulated by debt, in this case several of the larger companies are carrying proportionally more debt than Hennessy as well.
Management: While I think they are overpaid, Hennessy management is competent and adaptive. The company has adjusted its strategy over the years to grow the business by adding funds and providing more services, they are survivors of the 2008 financial crisis, and they have successfully integrated acquisitions. But I’m not impressed with the board, it includes family members and appears more typical of a 15 million nano-cap than a 175 million small cap. At the end of the day you have to be comfortable with Bill Hennessy as the CEO/Chairman and not expect much from the board; fortunately, he did build this company after all and appears to know what he is doing.
So is Hennessy cheap? Yes, but there is a reason mutual fund companies sell at a discount to the market. For Hennessy to continue growing at 15-20%, several trends must continue to be favorable: general market performance needs to remain bullish, the company’s largest funds (Focus, Gas Utility) can’t have bad years, newly purchased fund assets need to be at least somewhat sticky, and new acquisitions must be available for purchase at fair prices. I’m not betting the company goes five for five on that list, but then I also don’t believe the price I am paying requires perfect execution either.
Conclusion: I recently bought Hennessy Advisors stock because I don’t believe the positive earnings trend is priced into the stock. But due to the inherent leverage in a market leveraged investment, the concentration of the majority of assets in just two funds, and the secular headwinds facing all actively managed equity funds I cannot justify over-weighting the position, but I expect it to continue performing better than the overall market until the next recession (whenever that is).
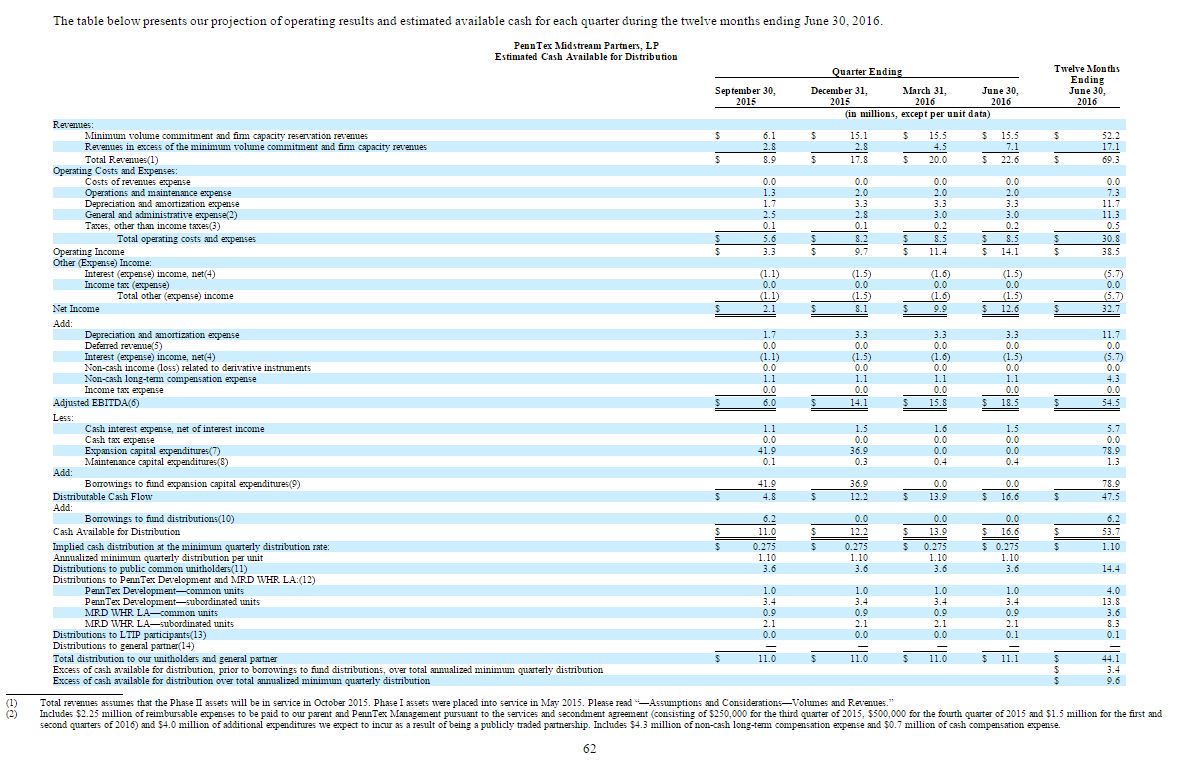
PennTex (PTXP) is a small midstream MLP backed by deep pocketed NGP Partners with two gas plants and a gathering system in Northern Louisiana serving the prolific Terryville field in the Cotton Valley formation. For years, vertical wells in this region have yielded mostly mediocre results, but with horizontal drilling, mile long laterals, and hydraulic fracturing are changing the game. PennTex’s sister company, the well hedged Memorial Resource Development (MRD) is using these techniques to develop Marcellus class wells in the Terryville without the infrastructure constraints of Appalachia. After last year’s IPO, PTXP is already down over 50%, but yielding a relatively secure 11% covered by a minimum volume commitment (MVC) contract and a subordinated share structure. PennTex is basically an “earn while you wait” situation. While 11% is not bad, only a modest increase in oil prices to $45-$50/barrel and $2.50 gas is required for PennTex to obtain the volume increases necessary to feed even higher distributions. Given PennTex’s secure distribution and future prospects, the yield on the distribution should reset to a more appropriate 7-8% yield once the winners and losers in the MLP space are sorted out and generate a corresponding share price increase as well.
Why does the opportunity exist now?
All midstream MLP’s are getting hammered in the MLP selloff, and most of them for good reason. If your midstream operation is servicing a high cost basin, or bankruptcy bound partners like Chesapeake, then your MLP’s value should be impaired. I will argue however that PennTex is the exception due to its strong distribution coverage. It is a case of the baby getting thrown out with the bathwater.
The stock price distortion is magnified for PennTex, because it is new and unknown, and because it is small. PennTex is just a 400 million market cap company with an even smaller public float of 125 million. At this size, a little forced selling by a distressed seller (see over leveraged closed- end MLP funds) can go a long way to depressing the stock price.
What is the long-term opportunity?
Memorial Resource Development (MRD) is PennTex’s primary customer and the counterparty to the MVC. Fortunately, MRD is fully hedged for its production through the end of 2017. Its primary asset is the Terryville field, a stacked play in the Cotton Valley formation in Northern Louisiana.
NGP partners directly and through affiliates owns 45% of MRD as well as PennTex’s general partner (GP), the Incentive Distribution Rights (IDRs) and 67% of PennTex limited partners (PTXP). NGP could run MRD at break-even and still make good money processing MRD’s wet gas through PennTex. This is critically important because when you own units in the MLP’s limited partner, you are at the mercy of the general partner to treat you well.
As a new MLP, the IDRs are currently set at zero, but the IDRs increase quickly to 50% with an 50% increase in the current distribution. In addition, at $1.60/year, the subordinated shares are converted to full shares.
Total Quarterly Distribution
Target Amount
Unit holders
GP (IDR holder)
Below $0.3163
100%
0%
above $0.3163 up to $0.3438
85%
15%
above $0.3438 up to $0.4125
75%
25%
above $0.4125
50%
50%
Following the original IPO prospectus and MRD’s 2015 drilling schedule, the IDRs were on target to be at 50% by 2017. With MRD announcing in January 2016 that it was reducing its drilling rig count from 8 in 2015 to 1 by Q2 2016, volumes may not be increasing as fast and the date to reach a $1.60/unit distribution will be correspondingly delayed. I say “may” and not “will” because MRD will still have 30 drilled, but uncompleted wells, available for completion by Q2 2016. But eventually, if drilling does not resume at higher rates, volumes will definitely decrease.
If $50 oil and $2.50 gas is reached by 2018, MRD will likely increase its rig count back to 2015 levels, and a $1.60 distribution or more would be a certainty shortly thereafter. Applying a 7% yield on the $1.60 implies a $22.58 share price and an annual return from capital gains and distributions would be approximately 27% per year. More aggressive oil price projections would get you a much higher return.
The Terryville does not require $80 oil. Some of the best detail on MRD’s economics are in the April 2015 MRD Analyst Field Trip Presentation. The company offers claims a 200% IRR on Upper Red zone wells at, $60 oil and $3 gas, and a 122% IRR on the same wells with $50 bbl oil, and $2.50 MCF gas. I don’t think you have to be an oil bull to expect close to $50 oil by 2018. MRD shareholders may want $100 oil, but $50 is good enough at PNTX.
Given that these are all company supplied numbers, they probably do leave out corporate overhead among other expenses, but in any scenario, full scale drilling will return to the Terryville much sooner than say the Bakken or Eagle Ford with higher break-even points. And with the Terryville only two hundred miles from the Henry Hub sales point, Terryville gas sales without a negative pricing differential.
How well is the current $0.27 distribution covered in case we see no growth for a few years.
PennTex needs 11 million in distributable cash flows per quarter to cover a $0.27 distribution and until it completed its second plant in October 2015, it was not covering its distribution. But after the plant came online, the minimum volume commitment increased the following quarter to its present 340 MMCF/D.
The estimate in the IPO prospectus (see page 62 below) for the quarter ending July 2016, includes a full quarter at the 340 MMCF/D MVC rate shows $13.7 million in revenue from the MVC, 3.5 million in revenue for volume in excess of the MVC, and 5.5 million in pipeline usage fees for a total of 22.6 million. Against this, deduct 10 million in expenses, add back 3.7 million for EBITDA adjustments, subtract 1.9 for interest and maintenance capital and you get 16.6 million or coverage of 16.6/11 = 1.5x
Including “excess volume over MVC” if MRD is cutting back its drilling is dubious even if production in January 2016 is still 416 MMCFeD. But excluding that 3.5 million only reduces distributable cash to 13.1 million and coverage still remains strong at 13.1/11.1 or 1.2x.
But wait there’s more. PNTX has 40 million shares, and 20 million of NGP’s shares are subordinated. Public shareholders don’t need PennTex to generate 11.1 million in distributable cash to be paid $0.27/quarter, 5.55 million would cover the subordinated shares. We really have 2.4x coverage in case things get really bad.
And if you’ve read this far, I’ll share another secret. The MVC goes up one last time to 460 MCF/day after July 30, 2016. This will increase committed revenue from $13.7 million to $18.5 million. Frankly at 18.5, I will expect a small distribution increase even if there is no excess production.
Risks:
Bankruptcy
Previously I wrote about Sanchez Production Partners (SPP) which has a weak, over-leveraged E&P partner, Sanchez Energy (SN). While my SPP share purchase was good for a quick couple bucks, I sold them at the end of 2015 to avoid another year of K-1 returns and more importantly because SN is likely as not to go bankrupt and I have no clue how the contracts between SN and SPP will hold up in bankruptcy court.
MRD is the counterparty to the minimum volume commitment which underpins PennTex. MRD also owns full hedges on its production through the end of 2017, so unlike many E&P peers, bankruptcy from low prices is not on the horizon. MRD’s senior debt is not due until 2022.
While I am not particularly bullish on natural gas or crude oil, but I do think natural gas prices will eventually have to increase to a price sufficient to make drilling for gas in North America’s best fields, such as the Marcellus and Terryville at least marginally profitable. For the past five years, E&P companies have continued to drill unprofitable wells after unprofitable well just to hold on to a lease agreement so that they can keep the right to drill more unprofitable wells on that land, but ultimately the financing for this nonsense will stop, and these producers will eventually go bankrupt or shift to a more profitable business model and stop drilling unprofitable wells.
The Terryville Field doesn’t turn out to be as wonderful as it appears.
While the best Terryville Field and North Louisiana Cotton Valley horizontal wells appear to be as prolific as top Marcellus class wells the future need not be as bright as the past. Sweet spots are never as big as anyone predicts. Still the numbers in the April 2015 Analyst Day Presentation are definitely impressive.
And while one of the appeals of the Terryville field is that it is a stacked play, currently only the thickest sands in the stack (Upper Red) are near economic at current prices. The least appealing sands in the stack may require $80 oil to work out (see analyst day presentation).
Still what we do know about the Terryville is pretty darn good. The proved and developed reserves as reported by Netherland, Sewell, and Associates show reserves based on Dec 2015 12 month SEC prices ($46.75 oil/$2.59 gas) show proved reserves of 1378 BCFe. At the current 426 MMCfe/d rate gives a proved reserve life of 11.1 years. “Probable” reserves are twice as high. And “Possible” reserves are even higher, but then “Possible” is a pretty low standard, so it should be high. I was more impressed that the reserves held constant between year-end 2014 and year-end 2015, even though the SEC pricing deck for 2015 was nearly half the 2014 prices. Lastly, management pointed out that the decline history is favorably exceeding the auditor’s projection, so we may see future upward revisions.
In any case, this is a real field producing, real gas with NGLs and MRD continues to buy more leases in the area committed to PennTex. Whether it is a just a good field and we collect just 11% and a little bit more or a really good field and we collect 11% plus a lot more, we will learn in time.
PennTex may be unable to attract financing for growth
The current high yield on PTXP shares prevents their use in selling shares to raise new capital for expansion or acquisition. This is certainly a challenge for PennTex and all MLPs.
First, I don’t expect the yield to stay at 11%, but more importantly NGP has the resources to obtain alternative forms of financing such as convertible preferred stock. In the Nov 15 conference call, management mentioned that it wouldn’t be prudent to go to the capital markets at this time (sell more units), but implied they had private market options too.
MLP partnerships issue K-1’s and I hate K-1’s
True, but at least this one only has operations in Louisiana, so this doesn’t require filing in 20 states. PennTex does have a right of first refusal to build gas processing for NGP in West Texas, but since Texas, does not have a state income tax, it would not add to the paperwork.
No governance
The biggest risk of all is that you are purchasing units in a limited partnership is that the general partner can pretty much do whatever it wants. In our case, NGP owns the GP, the IDRs and with 68% of the PTXP LP units owns more of PTXP than public shareholders do, so in theory would like to see the LP succeed. Additionally, NGP Partners is a significant MLP player and it would impair its ability to do future deals if it treated unit holders unfairly. For instance, OZ partners own 10% of PTXP’s units. While the big boys at NGP may not care about a retail investor, I don’t think they want to treat a future source of capital like OZ poorly.
Lastly NGP also owns 45% of MRD and MRD needs PennTex to process MRD’s gas. And as previously mentioned, since NGP owns a higher percentage of PTXP than MRD but effectively controls both parties, NGP can optimize its earnings by having MRD’s gas processed through PTXP’s facilities. This become especially attractive once the IDRs kick in at 50%.
Conclusion
Barring $15 oil lasting for 5 years bankrupting MRD when its hedges run out at the end of 2017, downside protection is solid, and even a modest recovery in oil prices should ignite a growth story. Until then, we will collect a reasonable secure 10% and wait.
Have you heard the old joke about the efficient market professor who walks down the street with a student who bends down to pick up a $100 bill? The professor tells her not to bother, because if the $100 bill were real, it wouldn’t be there. Well Sanchez Production Partners (SPP) kind of looks a little like that $100 bill. I’m not sure it’s real either, but I think it’s at least worth bending over to check it out.
SPP is a small, 33 million market cap, formerly busted MLP, originally known as Constellation Energy Partners. It was picked up by the owners of Sanchez Energy (SN) last year to provide a GP/LP financing structure for funding SN via drop-downs to SPP. SPP’s assets are 60% midstream assets and 40% oil and gas production by EBITDA contribution. With the recently acquired midstream assets financed by the selling of 350 million in preferred shares to Stonebridge partners.
First the stunningly good news, on Nov 13, Sanchez initiated a forty cent quarterly distribution along with a plan for 15% distribution growth through 2019. At its current share price of $11, this is a 14.5% yield backed by 1.8x coverage for 2016. If the yield re-rates to 10%, the unis would trade for $16/share. And to top that, they also announced a 10 million dollar buyback on a stock that’s 1/3 the public float.
So is there a catch? Well if oil prices jump back up before 2017, not really, because production is fully hedged at $74/bbl and $4.17/mcf through 2016. But… SPP is only partially hedged and at lower prices for 2017-19. If oil bounces back to $65 before the hedges run out, life is good. Otherwise, challenges will loom.
First, lower oil prices will drop the coverage ratio. For example, the current $74 hedges and $24 operating expense leave a $50 spread, but $35 oil provides only a $10 spread. The current 1.8x coverage ratio is only possible because of the $74 hedges. Without higher prices, the distribution will funded only by the fee based mid-stream assets and the coverage ratio will drop to 1 at best. Furthermore, at low oil prices, SN won’t drill as many wells in the Eagle Ford which will result in less gas to process. Yes, there are minimum commitment numbers that help provide a foundation to the distribution, but the 15% distribution growth doesn’t occur unless the Catarina plant gets fully loaded, and that requires SN to drills more wells. The IR materials claim a 35% IRR on $60 oil, but no one is getting $60 anymore… Do they get 25% IRR on $50?
So is SPP a $100 bill lying on the ground? Yes, if oil goes back to $60/barrel in 2017, but it’s a mirage if oil drops to $35/barrel for an extended period. In between those prices it can still work, but maybe only turns out to be a $20 dollar bill and I think still worth bending over to pick up. With the hedges solid for 2016, I’m long SPP, but I am keeping it on a short leash.
For more information:
Nov 12 Q3 2015 Conference Call. My favorite part is describing that the limiting factor to the buyback is effectively the low trading volume. Management basically states that they will be buying 25% of the daily volume.
There are also other moving parts in play, such as the planned sale of the legacy mid-continent producing assets, the health of Sanchez Energy, the appropriateness of holding production assets in a MLP, etc. But if I wait to write those down, I will never finish the post.